
Project Related Descriptors
The following descriptors have been written to summarize a variety of facts and methods that are relevant to our project, which can be used in paper writing, in presentation preparation, or for reference purpose. The whole project team contributes to these descriptors, and special thanks go to Dr. Hsiang Ling Chen, Cindy Tsai, and Shuang Yang.
Fanjingshan National Nature Reserve (FNNR) is located in Guizhou, a province in southwestern China (N27º44´42˝-28º03´11˝, W108º34´19˝-108º48´30˝). It was established in 1978 as a protected area for the Guizhou golden monkey (Rhinopithecus brelichi), and then extended to its current size in 1986 in order to conserve other animal and plant species within the reserve (Guizhou Department of Forestry and Fanjingshan National Nature Reserve Administration 1990). Spanning 419 km2, the reserve is divided into a core zone of highly regulated primary forest and a surrounding buffer zone. FNNR is within one of the 25 global biodiversity hotspots identified by Myers et al. (2000), with over 3000 animal, plant, and insect species (Yang, Lei, and Yang 2002). The reserve contains a relatively large amount of undisturbed primary forests compared to other areas at the same latitude and is also home to a high level of biodiversity. To date, over 5000 species have been identified, including 3000 animal species. A handful of these species are listed as first-class or second-class protected wildlife species according to in China’s Wild Animal Protection Law. Exemplar species include the clouded leopard (Neofelis nebulosa) and the Asiatic black bear (Ursus thibetanus).
There are 25 villages and over 13,000 people living in the reserve. Around 70% of local population is ethnic minorities such as Tujia and Miao (GEF Project Team 2004, p.8). Traditionally, local residents grow subsistence crops and vegetables, and raise pigs and other livestock. Local people are allowed to enter non-core habitat areas for resource collection and livestock herding, though illegal production of charcoal, wood extraction, and poaching also occur year round.
FNNR has experienced rapid changes in land use, economic growth, tourism development, and demographic patterns. At the same time, the dynamics of deforestation and reforestation characterize transitions in FNNR forest cover (Wandersee et al. 2012). Major causes of land changes in FNNR include implementation of Natural Forest Conservation Program (NFCP) and the Grain-to-Green Program (GTGP), two large nationwide programs focusing on payments for ecosystem services. The GTGP was initiated in FNNR around 2000, at which time 774 households enrolled land parcels in the program primarily in the reserve. In FNNR, farmers planted pine, Chinese fir, bamboo, and sometimes other species with seedlings provided by the local government. While FNNR officials consider the GTGP a success in promoting wildlife conservation, this has not been tested and verified by empirical research.
We administered household interviews based on a stratified random sampling strategy in 2014 and 2015. With a roster of all 3,256 households in 2013 (FNNR did a census in 2013), we decided to target on 850 households (this number was increased to 1160 later), larger than our intended sample size of around 650 households, for various reasons such as inability of finding a knowledgeable person in the household and/or absence of household members due to travel. We decided to break the whole 3256 households into 123 sampling units, and we randomly selected 58 from the 123 units. We then randomly assigned these 58 sampling units into a total of 20 administrative villages (the smallest unit of villagers’ autonomy in China) within FNNR largely in proportion to each administrative village’s population size. In this way small administrative villages will be slightly over-represented in our sample. Then at each administrative village, we took a random sample according to the number of sampling units it received on a 20 households/unit basis: If an administrative village has one unit assigned to it, 20 households would be randomly selected; if 2 units, then 40 households, and so on. In such a way, 1160 households were selected to the sampling pool, and eventually we managed to complete a full survey of 605 households out of this sampling pool in 2014.
In 2015, we revisited all these 605 households with a focus on household land use, participation in the GTGP and NFCP programs, and detailed household income. We ended up with a survey of 494 households in 2015.
In 2016 we took a clustered, non-random sample of all households in five natural villages within two administrative villages of Pingsuo (坪所) and Taohuayuan (桃花源). The aim was to have a full coverage of socioeconomic, demographic, and livelihood data of all households in these two administrative villages for various modeling, verification, and data analysis purposes (e.g., to build and validate an agent-based model). We surveyed all the available households in these two administrative villages, ending up with a total of 94 households.
The original subsidy of GTGP was proposed by China’s central government in 2000 (国发〔2000〕24号), where the compensation included 150 kg of grain and 20 yuan (RMB) of cash per mu per year for land parcels in south China (for land parcels in north China, 100kg and 20 yuan), for 8 years. With the 8-year extension of GTGP in 2007 (国发〔2007〕25号), the compensation was almost halved: 135 yuan in south China and 95 yuan in north China, no more grain subsidies.
The actual amount of compensation varies from province to province. For example, compensation carried out in Guizhou province (where FNNR is located) was all cash — grain subsidies were replaced by equivalent cash at market value. The total compensation there was 239 yuan for the first 8 year, and 134 yuan for the 8-year extension.
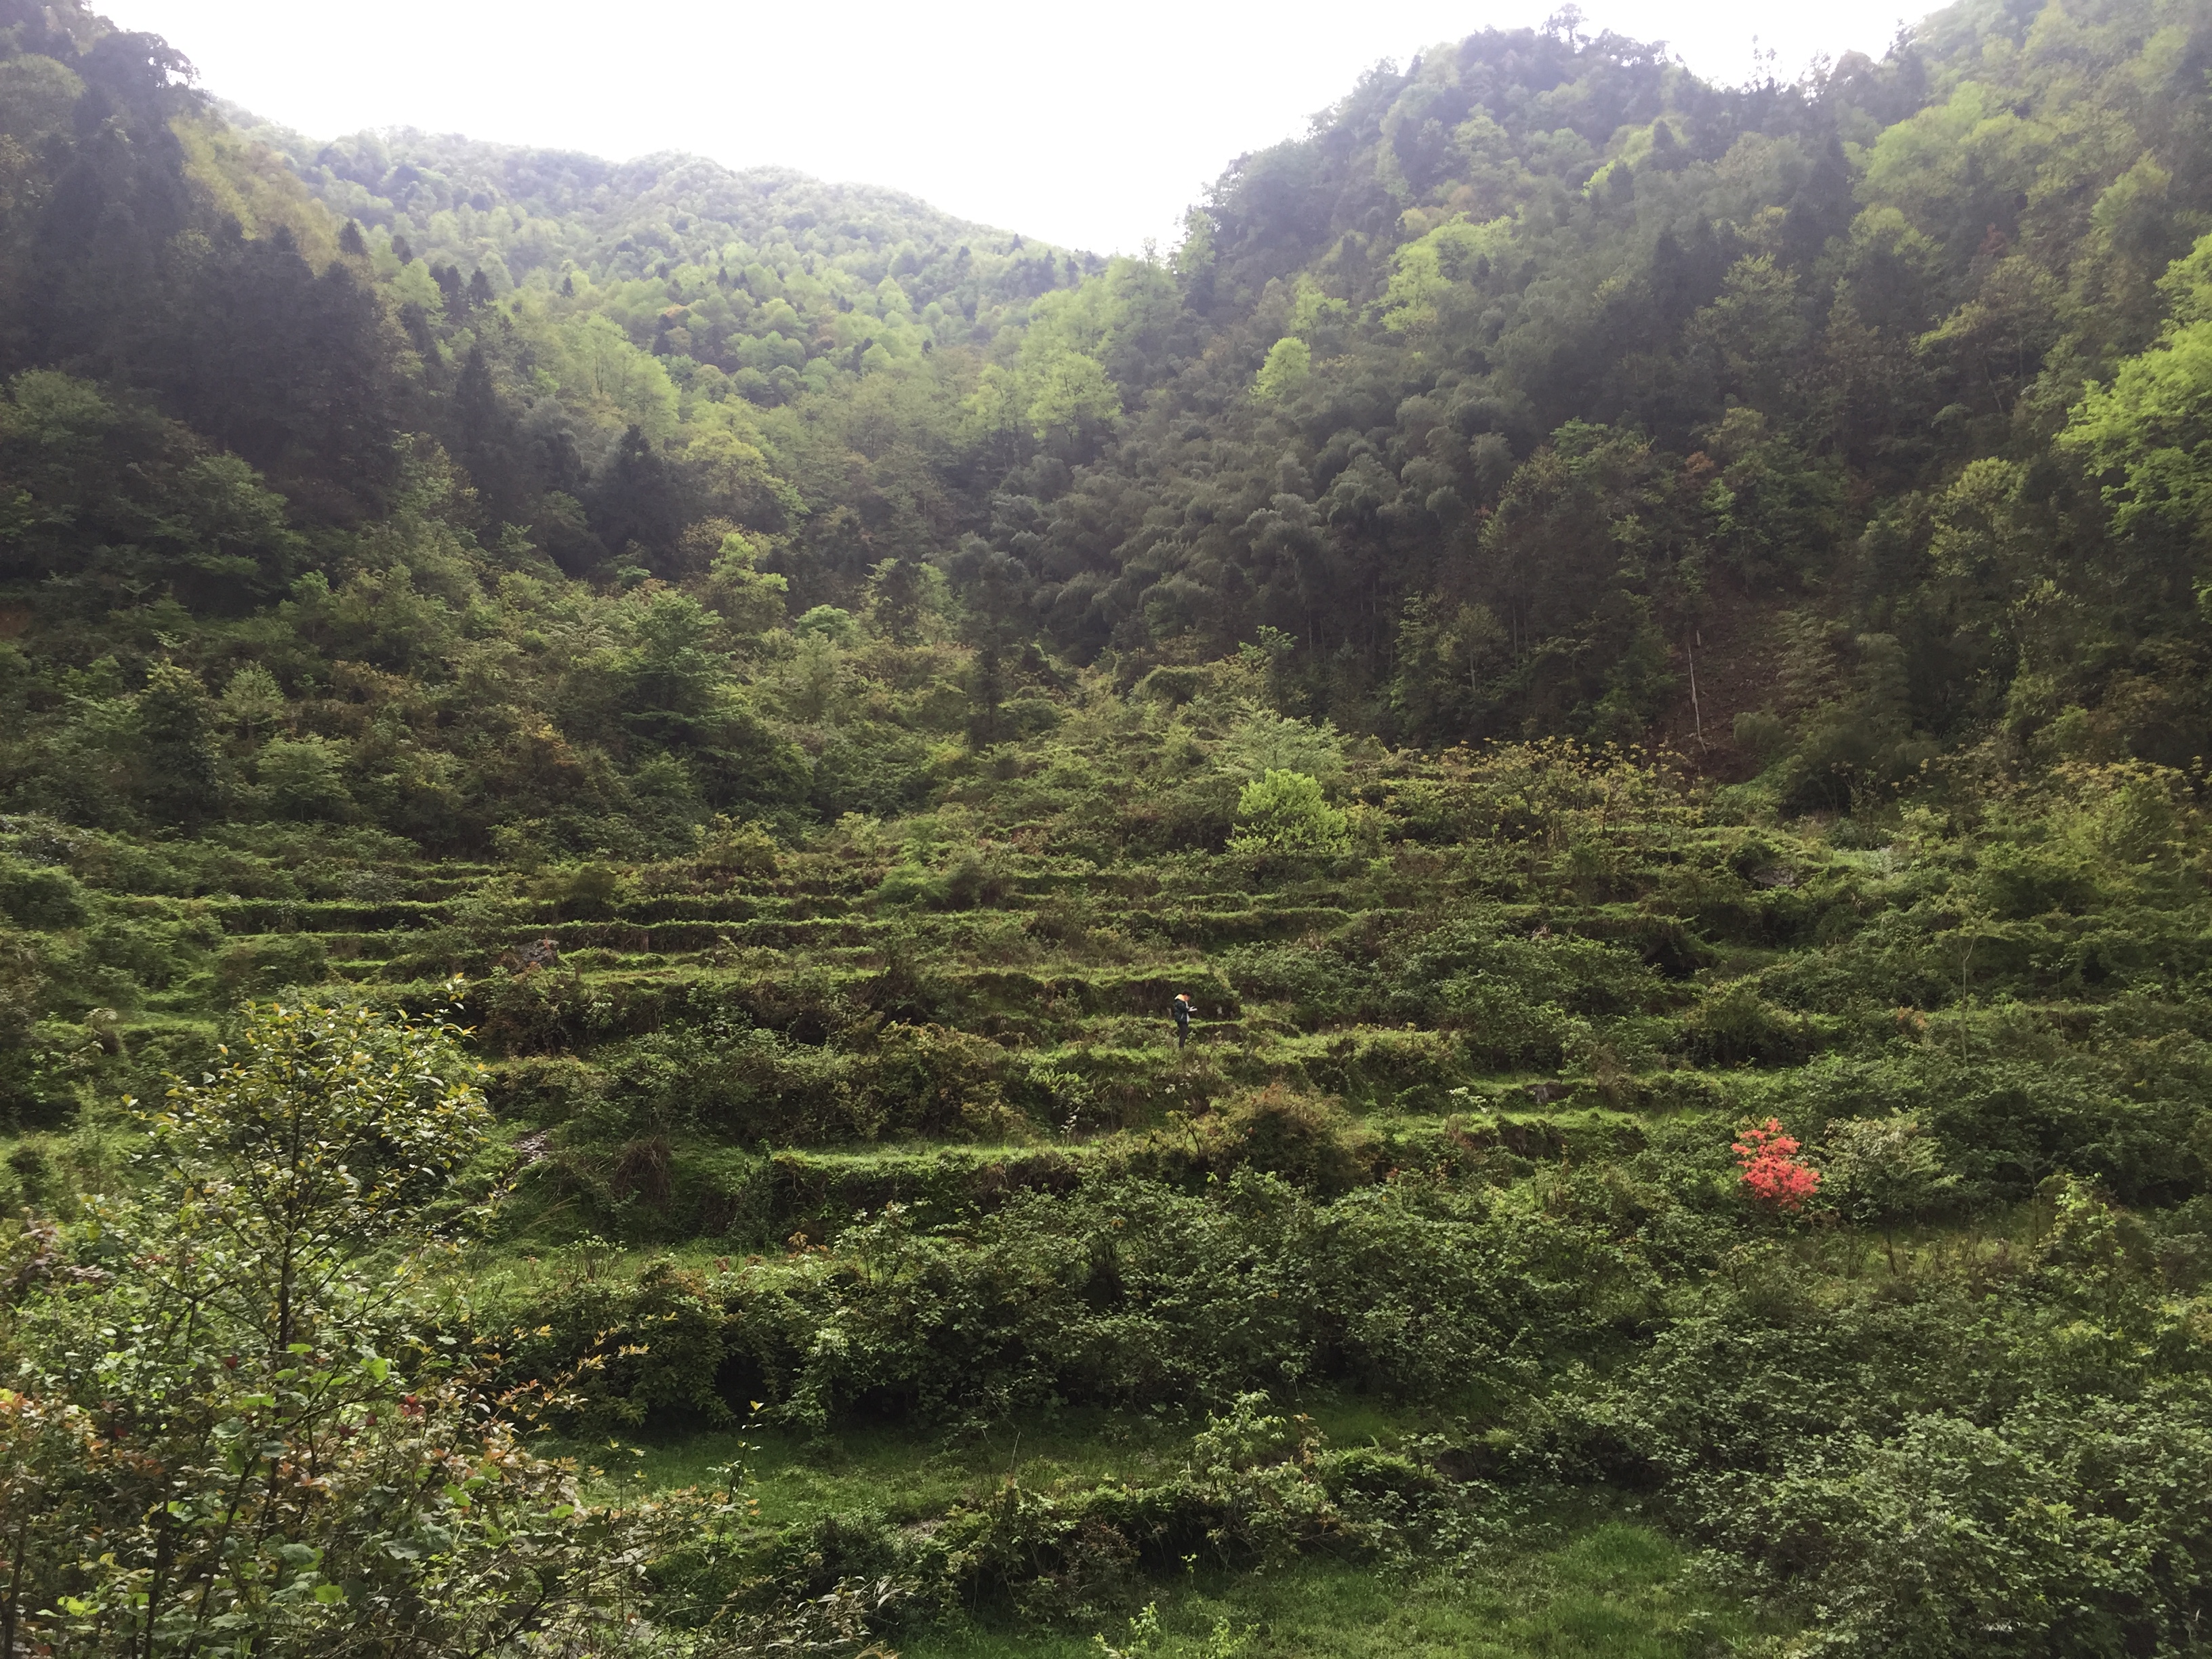
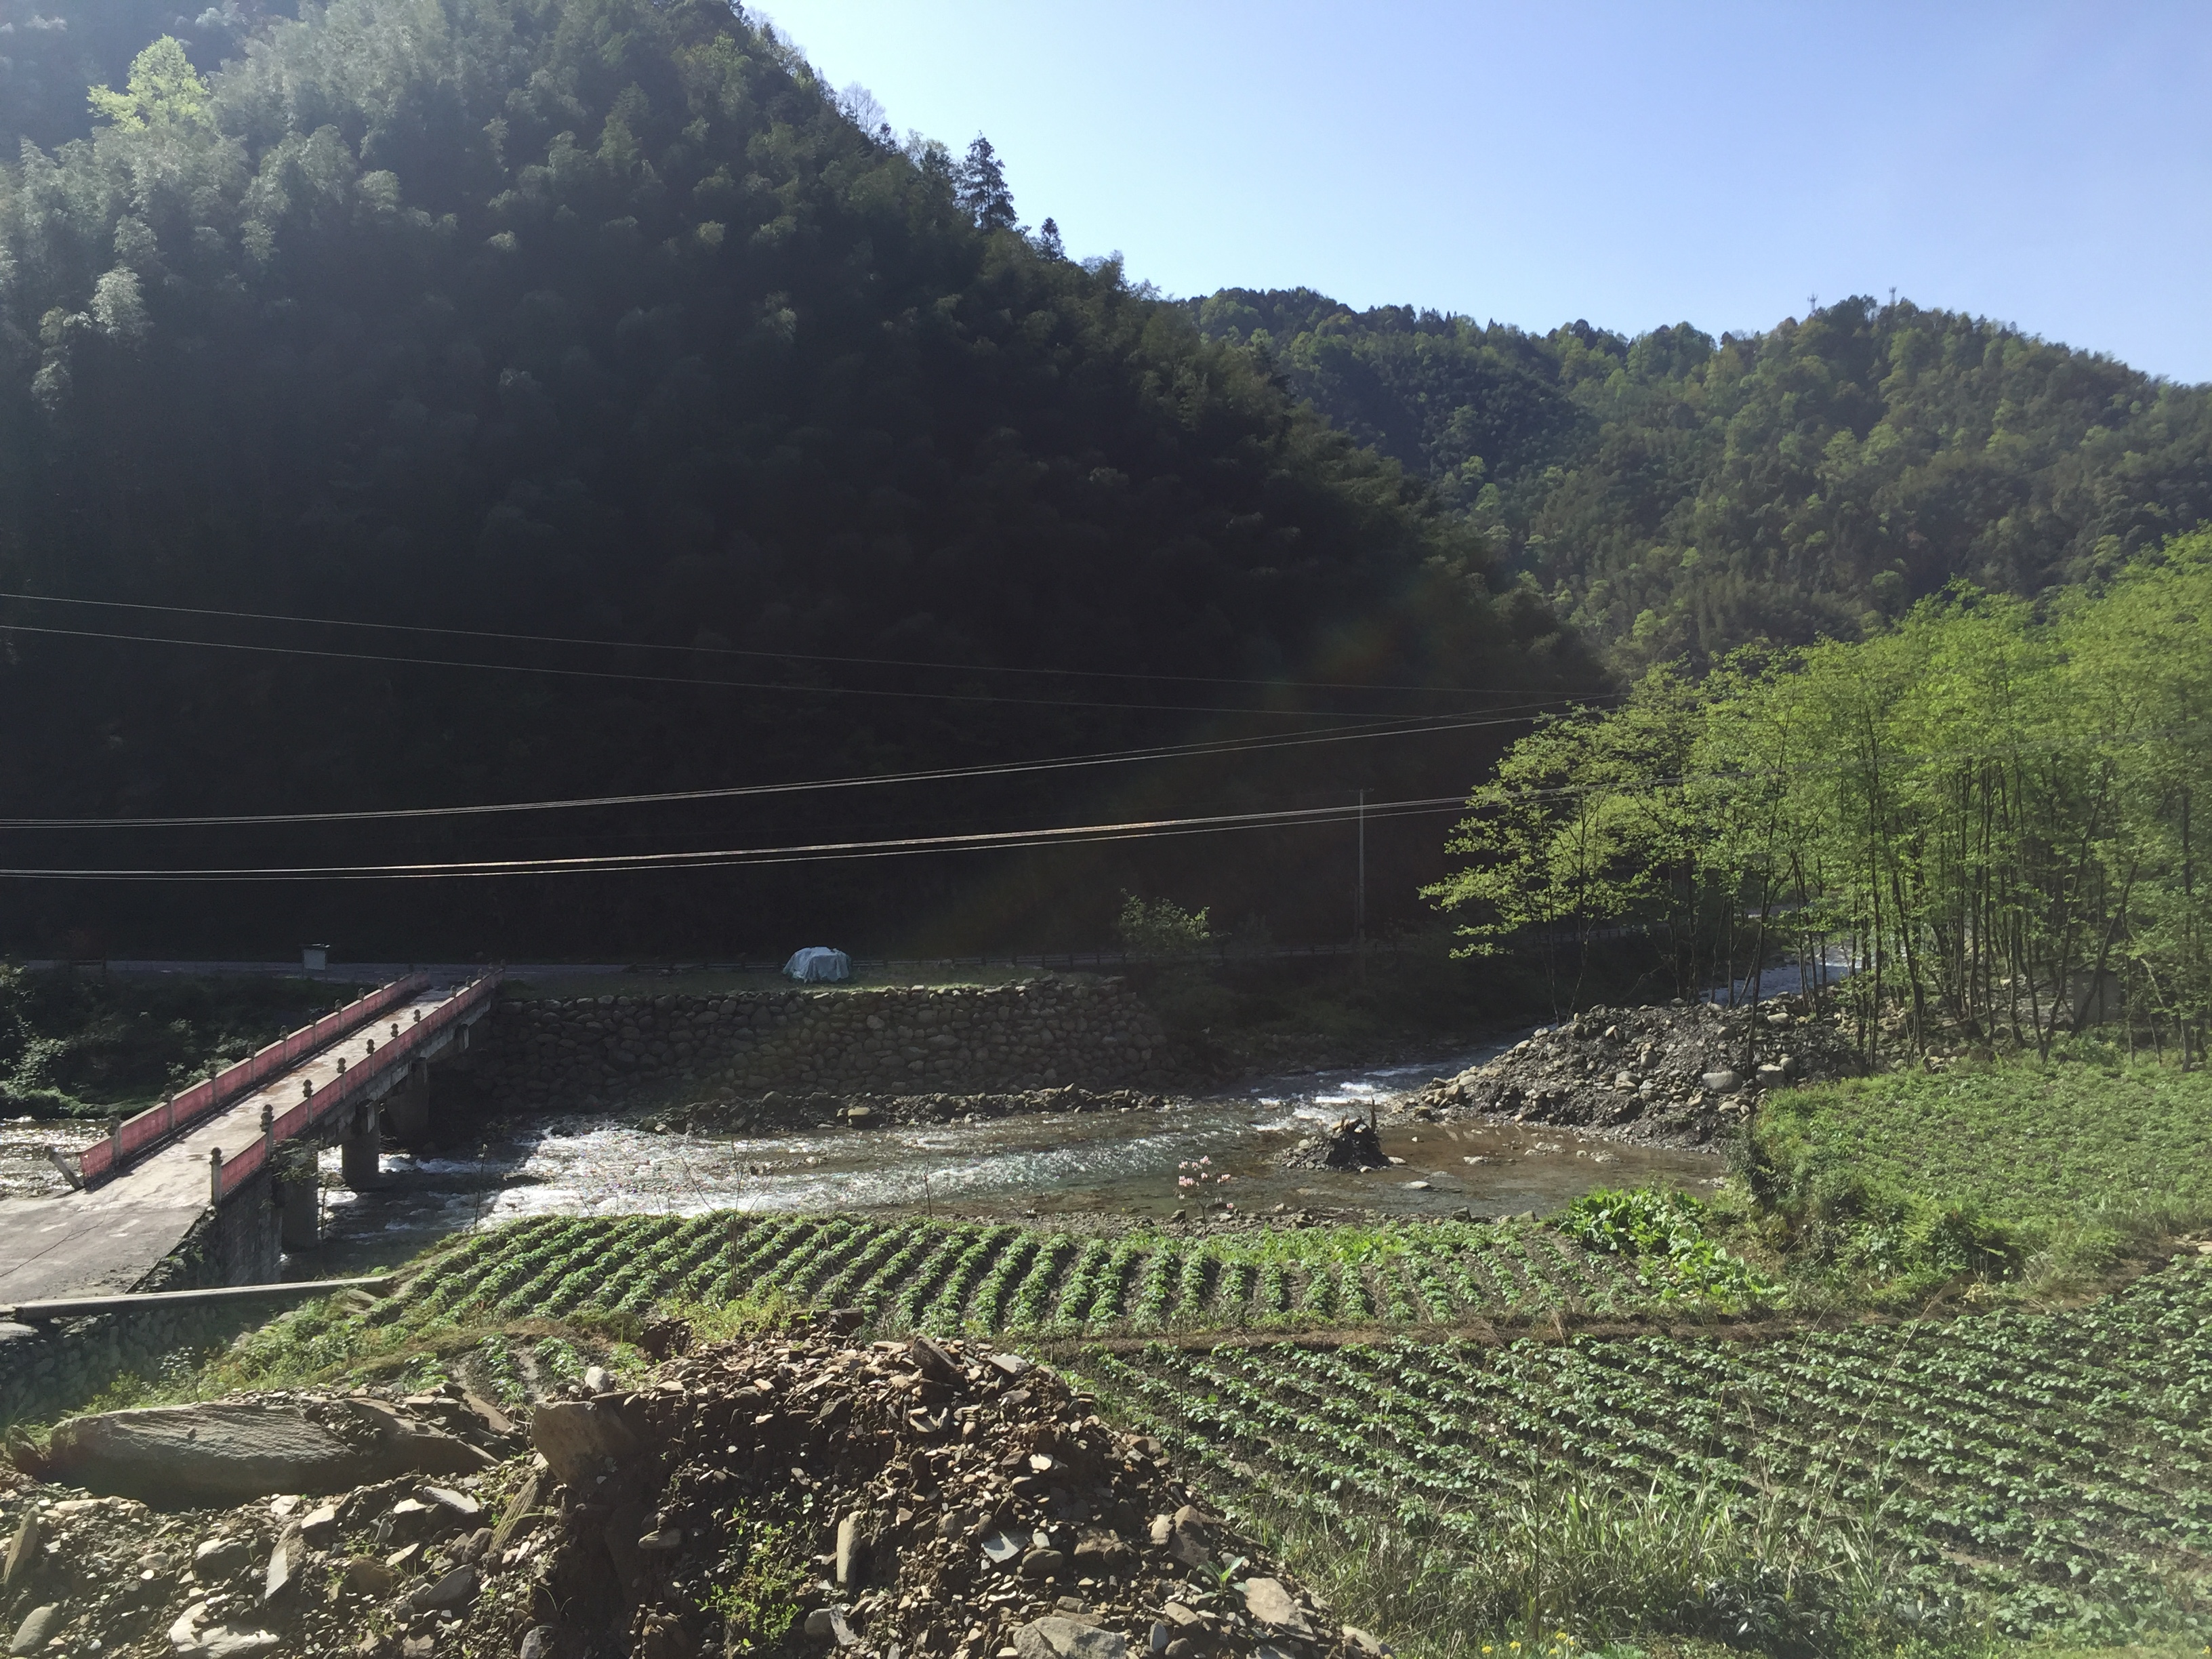
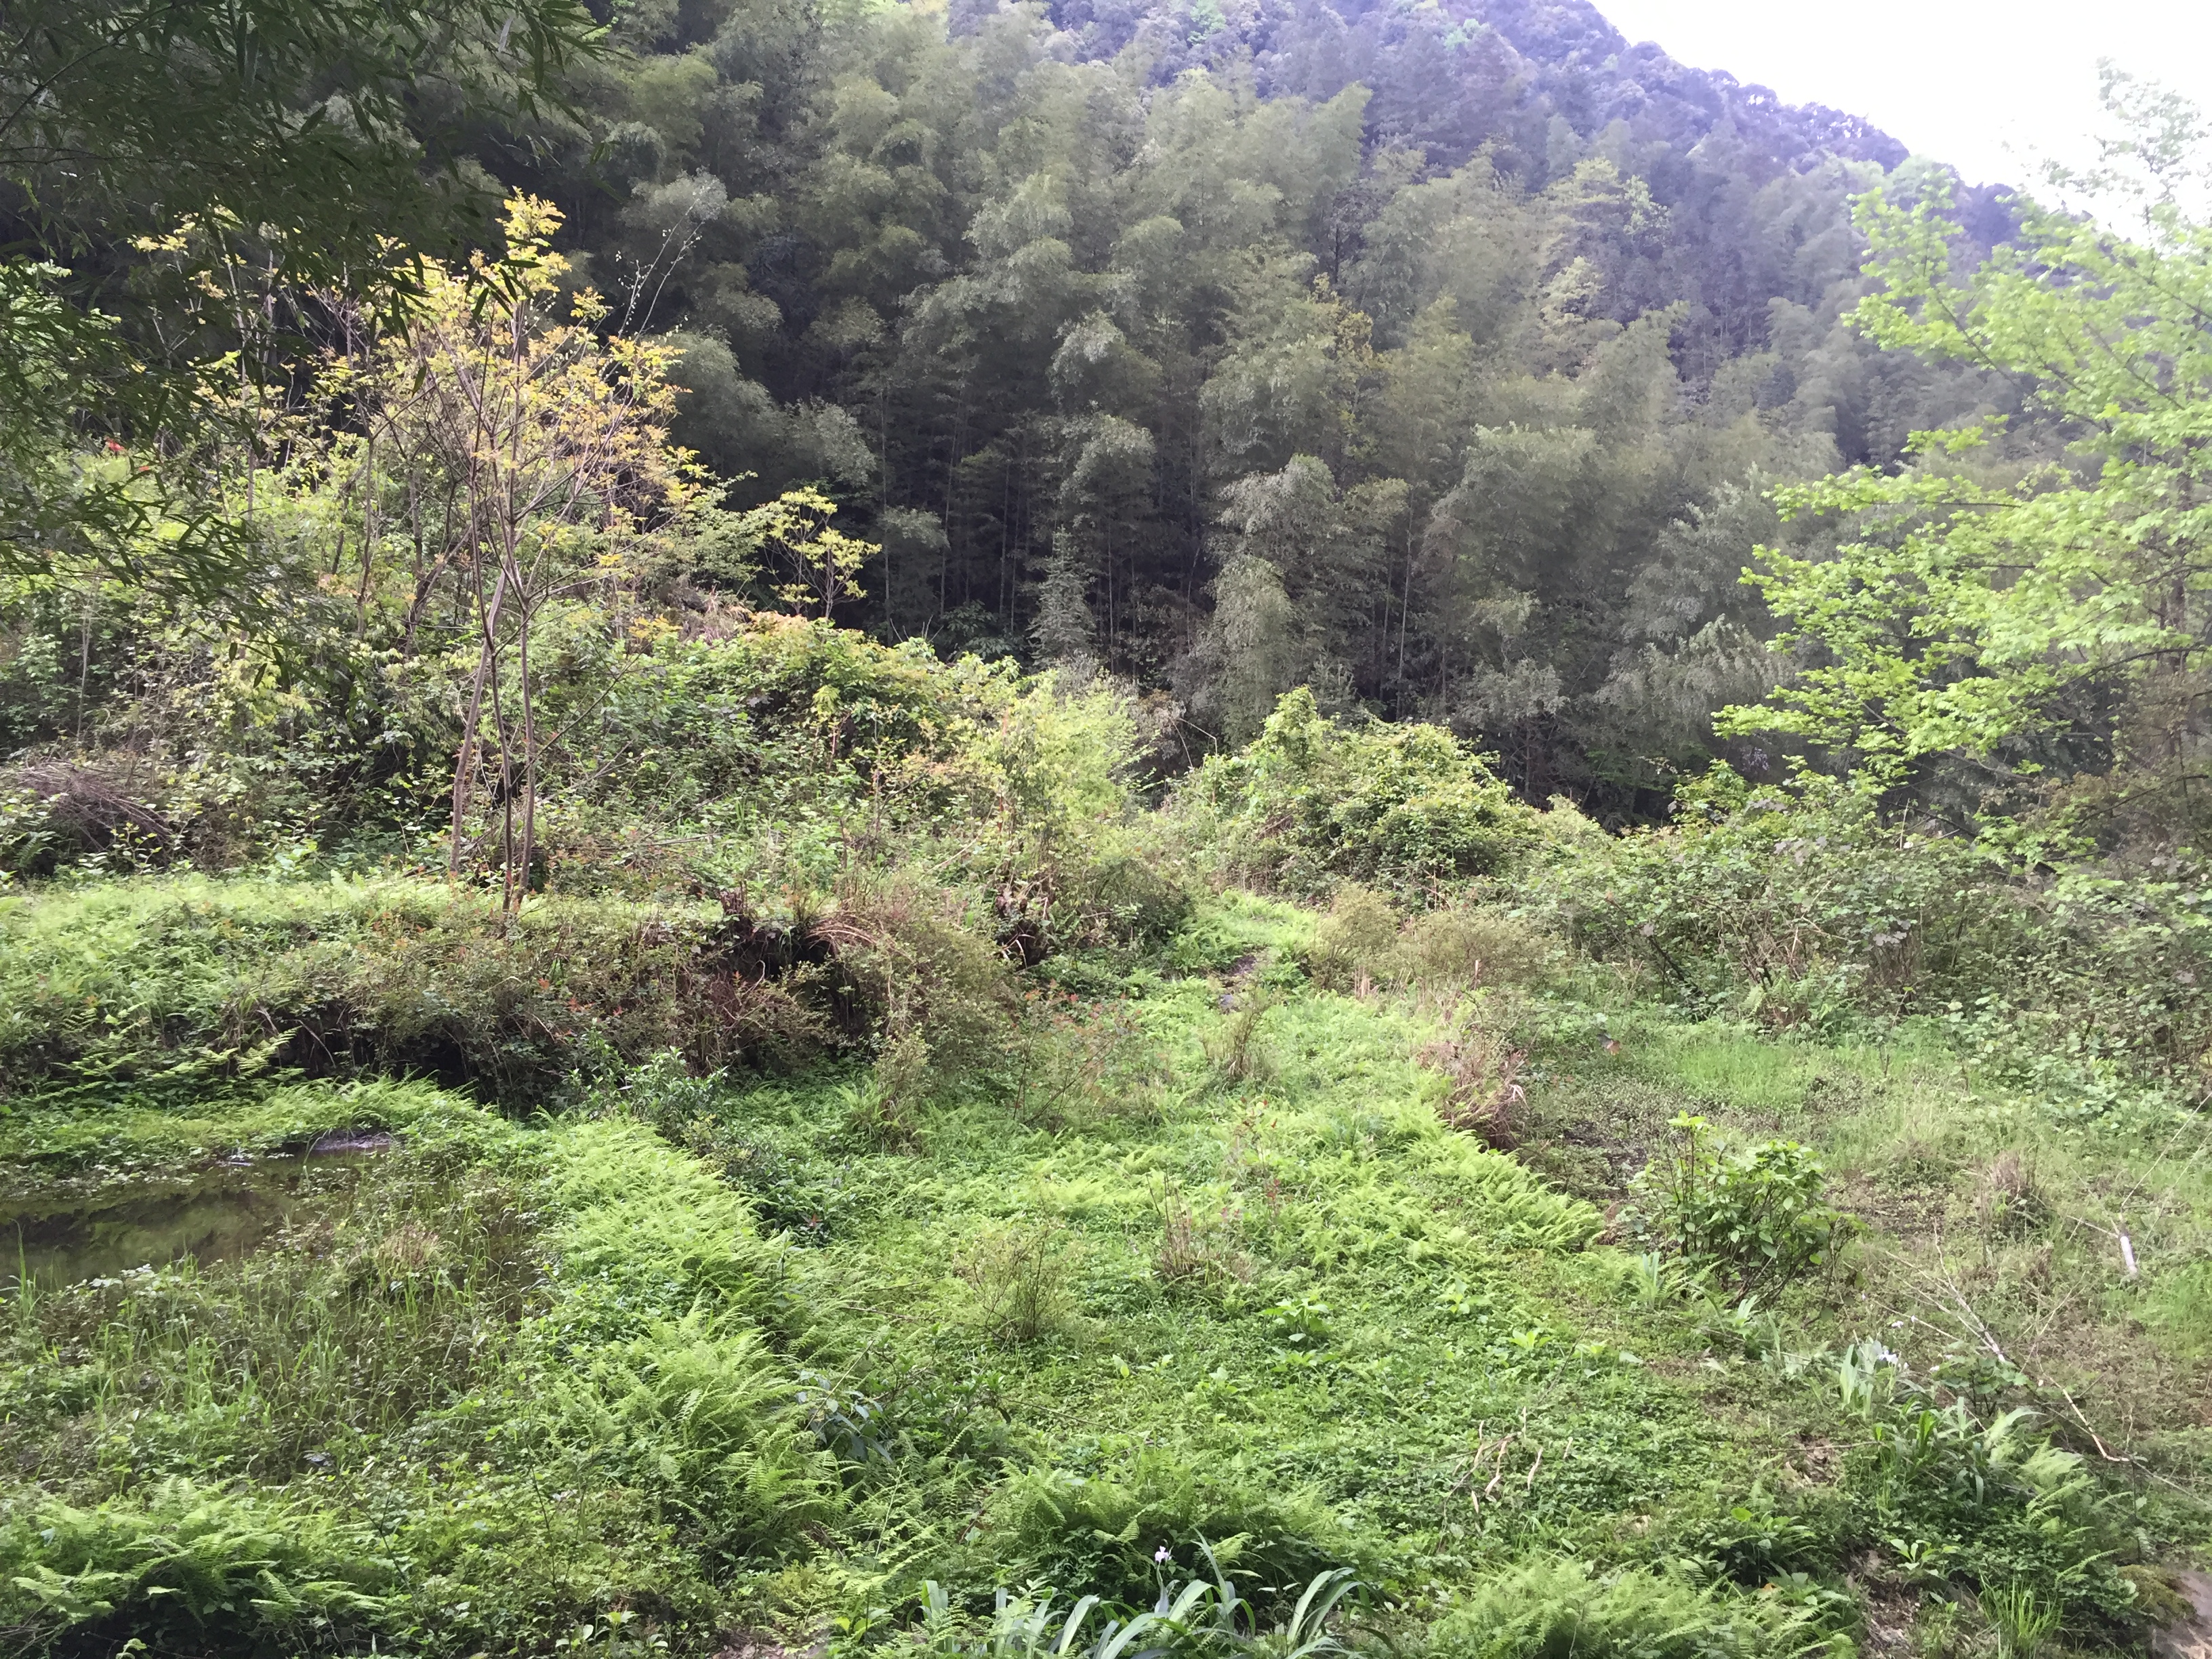
The amount of compensation actually received by local farmers varies at natural village level. Farmers in some villages received a portion of or even none compensation, as the village authorities diverted the money to other purposes. With the compensation agreement not fully in place, frustrated farmers could enroll less or none of their land in the next around of GTGP, or spend less time taking care of the trees planted on the GTGP land already enrolled. Photo 1 is a 4.5 mu GTGP land that was once a rice puddle in the village Hongshixi. The owner enrolled this parcel into GTGP in 2008, and he was supposed to plant Japanese fir and take care of the trees such as dredging ditches to drain the water. However, zero compensation received as the village use the compensation money to build a bridge (Photo 2) of the river, this household just left the parcel as fallow land, paying no attention to the trees. The trees (Japanese fir) then died due to over watering, and the land now is nothing but just a swamp (Photo 3).
Ground Level Reference Data Collection and Processing:
Digital hemispherical photographs (DHP) were collected in Fall 2012, Spring 2013, Spring 2015, Fall 2015, and Spring 2016. Relatively homogeneous 20 × 20 m2 and 30 × 30 m2 areas were chosen as survey plots in FNNR based on common vegetation types in the reserve (i.e., deciduous, evergreen broadleaf, mixed deciduous and evergreen, afforested bamboo, and afforested conifer), and the goal was to cover a range of canopy closure. Depending on the time availability and terrain difficulty, five, nine, or thirteen spatially stratified photo points were collected within each plot. All plots are oriented towards north, measured by a compass; photo locations were recorded with a GPS receiver. DHP data were collected with a Nikon D7000 camera equipped with a Sigma 4.5 mm fisheye lens, mounted on a tripod 1.3 m away from the ground. The camera lens was adjusted to face upward to the sky, and perpendicular to the ground using the theodolite on the tripod. Six photos with exposure values (EV) ranging from -4 to +1 at each photo location were taken.
DHP data were processed semi-automatically in two phases to derive ground level fractional cover: (1) an unsupervised image classification with a set of IDL scripts in ENVI, and (2) gap fraction estimation using CAN-EYE (https://www6.paca.inra.fr/can-eye). The red band of photos with EVs of -4 to 0 were first stacked and classified with Isodata unsupervised classifier. Each photo stack was classified initially to a maximum of 30 classes, based on pixel brightness value. The three classes with the brightest values were assigned as sky, while the rest of the classes were assigned as canopy. The binary DHP data were processed through CAN-EYE to calculate for canopy cover. A 10° circular mask was applied in the software to limit the canopy cover calculation to the center portion of each photo, as cover fraction is defined as the nadir (or vertical) canopy closure (Weiss, 2014). The fraction cover for each plot is represented by the mean value of all photo points within the plot.
Relatively cloud-free Landsat 5 Thematic Mapper (TM) and Landsat 7 ETM+ data from the Landsat Ecosystem Disturbance Adaptive Processing System (LEDAPS) surface reflectance product for Path 126, Row 41 of the Worldwide Reference Systems were downloaded from the U.S. Geological Survey Earth Explorer website (http://earthexplorer.usgs.gov/). Images with less than 5% cloud cover were identified from all available summer (June–September) acquisitions from 1990 forward. Images captured on August 22, 1996 and August 16, 2011, with 0.1 and 4% cloud cover, respectively were selected for analysis. August dates were ideal to ensure maximum leaf development within deciduous and mixed deciduous-evergreen forest types and to minimize terrain shadows in the mountainous study area. The years allow us to examine canopy forest cover prior to and after the implementation of GTGP. Subset images 27 km (E–W) by 28 km (N–S) containing FNNR and its surrounding area for each date were extracted.
Canopy fractional cover (CFC) was estimated using modified soil adjusted vegetation index (MSAVI) as input to a spectral mixture model. Three terrain-influenced illumination strata were first developed based on an ASTER DEM: (1) shaded pixels (mostly northwest-facing slopes), (2) directly illuminated pixels (mostly southeast-facing slopes), and (3) other (mostly flat, northeast- and southwest facing slopes). Next, bare soil and densest forest endmembers were selected for all image strata and both images. Finally, canopy fractional cover was estimated using the following equation:
CFC = (V_pixel-V_open)/(V_canopy-V_open)
where V is the MSAVI value for a given pixel, open and canopy represent pure bare soil and densest forest endmembers.
Vegetation and Wildlife Surveys
To investigate vegetation structure and species diversity of plants and wildlife, we established 71 sampling plots in FNNR, with 55 sites at natural forest and 16 sites at GTGP lands. Each plot was 20 m x 20 m. Location of plots was decided on the basis of accessibility, elevation, distance to other plots and suggestions provided by FNNR staff and local field guides with the goal to spread out plots across FNNR. We measured vegetation at 71 plots which were classified into five categories according to a vegetation map created by the Administration Office of FNNR: evergreen broadleaf forest (n = 15), mixed evergreen and deciduous forest (n = 30), deciduous forest (n = 9), bamboo (n = 6), and afforested conifer (n = 11). For each plot, we recorded species of understory, midstory, and overstory vegetation and estimated the percentage of cover for each species.
We used percentage of cover as an estimate of abundance for each species and calculated Shannon’s diversity index of understory, midstory, and overstory vegetation. We measured diameter breast height (DBH) of tree with DBH > 3 cm within 5 m radius from center and four corners of the plot and calculated maximum DBH, average DBH, and standard deviation of DBH for each plot. We used a range finder to visually estimate average tree height of the plot. We used a Nikon D7000 camera equipped with a Sigma 4.5 mm hemispherical lens to collect digital hemispherical photograph (DHP) to estimate canopy fractional cover (CFC), a measure for canopy closure defined as the percentage of tree canopy area (Wang et al. 2005; Pueschel et al. 2012). The camera was mounted on a tripod at 1.3 m in height from the base of the camera to the ground. The Nikon D7000 camera was programmed to capture six photos with exposure values ranging from -4 to +1 at each photo location to accommodate for different lighting and weather conditions. For each plot, we classified each DHP image into canopy or sky, and calculated average CFC for the central portion (10 degree) of all images taken at the plot (Pueschel et al. 2012; Weiss & Baret 2014). We estimated percentage of understory cover at plots visually.
We deployed a Bushnell Trophy Cam infrared camera at each plot to monitor presence of mammals (>0.5 kg) and pheasants from April 2015 to August 2016. We mounted cameras on trees 0.5 to 2 m above the ground. We set cameras at auto sensitivity to record three photos upon detection, with a 1-sec delay between photographs. We checked cameras every four months to assure proper functioning, changed batteries and memory cards, and retrieved images. We used multi-species hierarchical occupancy modelling (Dorazio and Royle 2005) to estimate the probability a species would occur within the area sampled by the corresponding camera during our survey period, while accounting for incomplete detection (MacKenzie et al. 2002).
References:
Dorazio, R.M., and J.A. Royle. 2005. Estimating size and composition of biological communities by modeling the occurrence of species. Journal of the American Statistical Association 100:389–398.
GEF Project Team. 2004. The Management Plan of Guizhou Fanjingshan National Nature Reserve. Jiangkou: FNNR GEF Project Management Plan Group.
Guizhou Department of Forestry, and Fanjingshan National Nature Reserve Administration. 1990. The Study of Fanjingshan. Guiyang, China: Guizhou People Press.
MacKenzie, D.I., J.D. Nichols, G.B. Lachman, S. Droege, J.A. Royle, C.A. Langtimm. 2002. Estimating site occupancy rates when detection probabilities are less than one. Ecology 83:2248.
Myers, N., R. A. Mittermeier, C. G. Mittermeier, G. A. B. da Fonseca, and J. Kent. 2000. Biodiversity hotspots for conservation priorities. Nature 403 (6772):853–858.
Pueschel, P., H. Buddenbaum, J. Hill. 2012. An efficient approach to standardizing the processing of hemispherical images for the estimation of forest structural attributes. Agricultural and Forest Meteorology 160:1–13.
Tsai, Y., D. Stow, L. Shi, R. Lewison, and L. An. 2016. Quantifying canopy fractional cover and change in Fanjingshan National Nature Reserve, China using multi-temporal Landsat imagery. Remote Sensing Letters 7(7): 671-680. DOI:10.1080/2150704X.2016.1177243.
Wandersee, S. M., L. An, D. López-Carr, and Y. Yang. 2012. Perception and decisions in modeling coupled human and natural systems: A case study from fanjingshan national nature reserve, China. Ecological Modelling 229 (Modeling Human Decisions):37–49.
Wang, C., J. Qi, and M. Cochrane. 2005. Assessment of tropical forest degradation with canopy fractional cover from Landsat ETM+ and IKONOS imagery. Earth Interactions 9:1–18.
Weiss, M., and F. Baret. 2014. CAN-EYE v6.313 user manual. French National Institute of Agricultural Research (INRA). Available online: https://www6.paca.inra.fr/can-eye/Documentation-Publications/Documentation
Proposed Research Directions
Dr. Stow – Canopy Cover Change
Drs. Chen, Wang, and An – Feedback, Education, and Resource Needs
Tsai – Remote Sensing
Yang – PES Surveys
Fieldwork
Hsiang Ling Chen – FNNR Fall 2015
Shuang Yang – Research Activities (2015)
Hsiang Ling Chen – FNNR Spring 2016
Shuang Yang – FNNR Spring 2016
Project Summit Meeting in 2016
A two-day summit meeting was held on September 23rd to 24th, 2016 in the SDSU Finch lab for our CNH Golden Monkey project based in Fanjingshan National Nature Reserve (FNNR), China. The purpose of the meeting is to share and present the methodologies, data, models, and findings related to the CNH project and discuss the plan for manuscripts and collaborations among project members. During the meeting, an overview of the project was given by Dr. Li An, followed by several presentations from project members: estimation of land cover change by remote sensing techniques and ground vegetation sampling by Dr. Douglas Stow and PhD candidate Cindy Tsai, participatory mapping and place attachment by Dr. Stuart Aitken, ecological data and wildlife occupancy modeling by Dr. Rebecca Lewison and Dr. Hsiang Ling Chen, household survey by Dr. Richard Bilsborrow and PhD candidate Shuang Yang, planning and design of protected areas in China by Dr. Weihua Xu from Chinese Academy of Sciences, and lessons and activity plans for K-12 education by Rose Ann Morris and Ruth Maas from local middle/high schools. The summit was a success, summarizing the past work and paving the way for future work such as publications and new grants for the project.
Papers under preparation include review papers about the payments for ecosystem services (PES) framework, ecological outcomes such as conservation of golden monkeys of PES, effects of human activity on wildlife in FNNR, improved methods of estimating canopy fractional cover, competitiveness among PES programs, correlations of migration and PES, and livelihood diversification effects of participation in PES. We discussed the challenges we face and possible solutions, including obtaining data about demography and environments in FNNR, limitation of personnel, time and funding for advanced data analysis and synthesis. We plan to create an introduction page about FNNR; enhance collaboration with research institutes in China, and seek funding for students and post-docs for further data analysis and synthesis as well as for future research about measuring ecosystem services directly in FNNR.
To view .pdf files you may need to download Adobe Reader.
To view Microsoft PowerPoint documents (.ppt) you may need to download PowerPoint viewer.